ENG
 VIE
 +84 9323 494 34


How to set a 2027 marketing budget by business growth stage
 November 13, 2026
 Tin Le
Contents
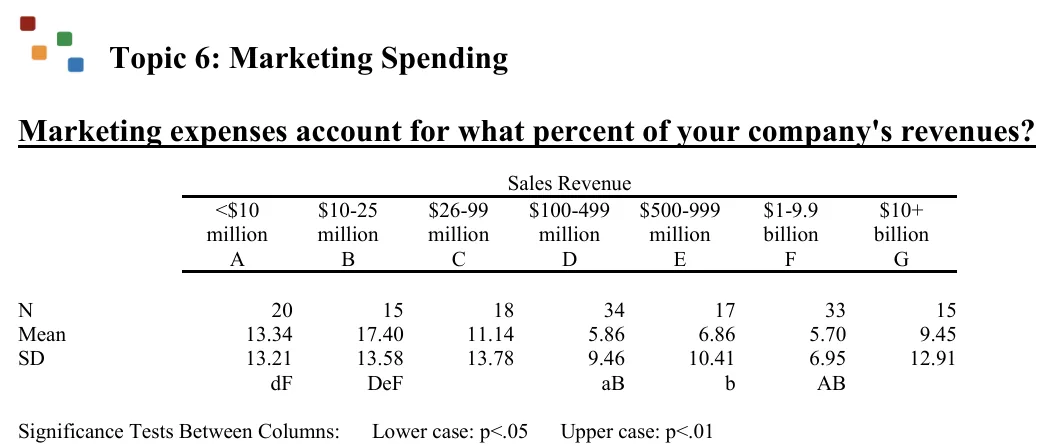
The most common way I see companies set a marketing budget is to take next year’s projected revenue, multiply it by 5% or 10%, and justify it with “that’s what other companies spend”. The paradox sits inside the very surveys people quote: the smaller the company, the higher its marketing spend as a share of revenue. In The CMO Survey 2026, US companies with revenue under USD 10 million spent an average of 13.34% of revenue on marketing, while companies in the USD 100 to 499 million band spent only 5.86%. Apply a market-wide average to a company that has just launched and you will almost certainly get the wrong number.
Your budget should follow the growth stage of your own business. By the end of this guide you will have a way to calculate it for each stage and a sample marketing cost sheet you can fill in for 2027.
Marketing budget as a share of revenue: what the surveys say
The two surveys most often quoted on marketing budgets are The CMO Survey (run by Duke University, Deloitte and the American Marketing Association) and Gartner’s CMO Spend Survey. Both ask marketing leaders in North America and Europe. Vietnam has no comparable public survey, so treat the figures below as a reference point only.
| Survey | Market and sample | Marketing budget as a share of revenue |
|---|---|---|
| The CMO Survey 2026 (fielded January 2026) | US companies, 308 marketing leaders responded | Mean 8.96%, median 5% |
| The CMO Survey 2026, by company revenue | 15 to 34 companies per band | Under USD 10 million: 13.34%; USD 10 to 25 million: 17.40%; USD 26 to 99 million: 11.14%; USD 100 to 499 million: 5.86% |
| The CMO Survey 2026, by business model | 18 to 61 companies per group | B2B product 7.02%; B2B services 10.07%; B2C product 11.99%; B2C services 7.24% |
| Gartner CMO Spend Survey 2026 (January to March 2026), as reported by Medianews4u | 401 marketing leaders in North America, the UK and Europe | 7.8% (2025: 7.7%) |
A mean of 8.96% next to a median of only 5% tells you that a handful of heavy spenders pull the average up. Each revenue band has only 15 to 34 respondents, so the margin of error is wide. Small companies spend a higher share because their revenue is still small, yet they still have to pay a minimum amount to win customers at all (see the image below, the Mean row). That is why the ratio of marketing spend to revenue is only useful as a cross-check after you have built your budget from the bottom up.
Setting a marketing budget across 4 growth stages
I split businesses into four stages, much like the pillar guide on growth marketing picks which AARRR stage to prioritize at each point in a company’s life. Each stage calls for a different growth strategy, so the way you calculate money changes too.
| Stage | Signs | How to calculate the budget | Brand : performance (my starting point) | Key metrics |
|---|---|---|---|---|
| 1. Just launched | Orders do not yet come in every week | Learning budget: number of hypotheses × events needed × estimated CPA (cost per purchase) | 10 : 90 | CPA, conversion rate |
| 2. Searching for product-market fit | Orders come in, but few customers return | Hold ad spend steady; put any extra money into the product and customer care | 10 : 90 | Retention rate by customer cohort |
| 3. Scaling | Cohort retention has stabilized and CAC sits below its ceiling | New customers needed × planned CAC, plus retention, brand and testing | 20 to 35 : 65 to 80 | CAC (cost to acquire one new customer), LTV/CAC, payback period |
| 4. Mature | Growth is slowing and existing customers bring most of the revenue | Share of revenue, checked against surveys of similar-sized firms and validated with MMM (marketing mix modeling) | 40 to 60 : 40 to 60 | MER (revenue / total marketing spend), brand lift, incremental contribution by channel |
Stage 1: just launched, a budget for learning
You do not yet know who the customer is, which message sells or which channel is cheap, so your budget is the price of lessons. Ad systems also need enough data before they can learn. Meta calls this the learning phase: an ad set is flagged Learning limited when it is unlikely to get about 50 optimization events (for example, purchases) in the week after its last significant edit. Meta suggests raising the budget, combining ad sets, or picking an event that happens more often, such as add to cart instead of purchase (Meta Business Help Center).
Example (hypothetical figures): I am launching a herbal shampoo line and want to test three audiences on Meta, optimizing for purchases, with an estimated CPA of VND 150,000.
- Each audience needs about 50 purchases a week: 50 × 150,000 = VND 7.5 million a week.
- Three audiences over two weeks: 3 × 7.5 × 2 = VND 45 million.
- If I only have VND 15 million, I optimize for add to cart instead (assume VND 30,000 per event): 3 audiences × 50 × 30,000 × 2 weeks = VND 9 million.
The formula for a new product’s marketing cost is: learning budget = number of hypotheses × events needed per hypothesis × estimated CPA. Think of a restaurant testing a new dish: you cook enough portions to see whether guests order it again, not an amount based on the restaurant’s monthly revenue.
Stage 2: searching for product-market fit
Product-market fit means there is a group of customers who buy, use the product and come back on their own, without you paying to bring them back. The signal I look for is a retention rate curve by customer cohort that flattens out.
Example (hypothetical): 100 customers place a first order in March. Three months later 22 of them have bought again, and after six months 20 are still buying, so the curve is almost flat at 20%. If only 3 people remained after six months, you would not have product-market fit yet, and more advertising would only buy you customers who leave faster.
At this stage I keep ad spend at the stage 1 level and put the extra money into fixing the product, the sales page and post-purchase care, and into calling customers to ask why they did not come back. How to read retention alongside other growth marketing metrics such as MER and LTV is covered in the pillar guide on measurement.
Stage 3: scaling, a budget built from CAC
Once customers return reliably, the question becomes how much each new customer is worth and how many new customers you need. You now have unit economics (profit or loss per order and per customer) to calculate with confidence.
CAC ceiling = 12-month LTV measured in profit / a multiple you choose. I usually use an LTV of three times CAC as a safe benchmark for consumer goods sold online. The payback period is the number of months it takes for the profit from one customer to cover that customer’s own CAC. If the first order earns VND 157,500 in profit and CAC is VND 120,000, you are paid back on the first order. This is where scaling companies tend to run short of cash: CAC is paid today, while profit arrives months later.
Stage 4: mature, rebalancing toward brand and measuring real contribution
Once you have a large customer base, new customer growth slows and the pool of people who are already in the market starts to run dry. A share-of-revenue budget becomes more useful here, but compare yourself with companies of the same size and business model in the survey table above.
Brand building should grow step by step, because your future customers need to know you before they need you. To find out which channel actually adds revenue, measure with marketing mix modeling, incrementality testing and brand lift studies for the brand side. The ROAS report inside an ad account cannot answer that question.
Marketing budget allocation: brand vs performance, new vs existing customers
Brand building is like planting trees: there is no fruit today, but in a few years the trees feed the whole orchard. Performance marketing, or activation, is like picking the fruit: it closes people who already want to buy and brings orders this week. Good brand marketing makes performance cheaper, because people have already heard of you before they see the ad.
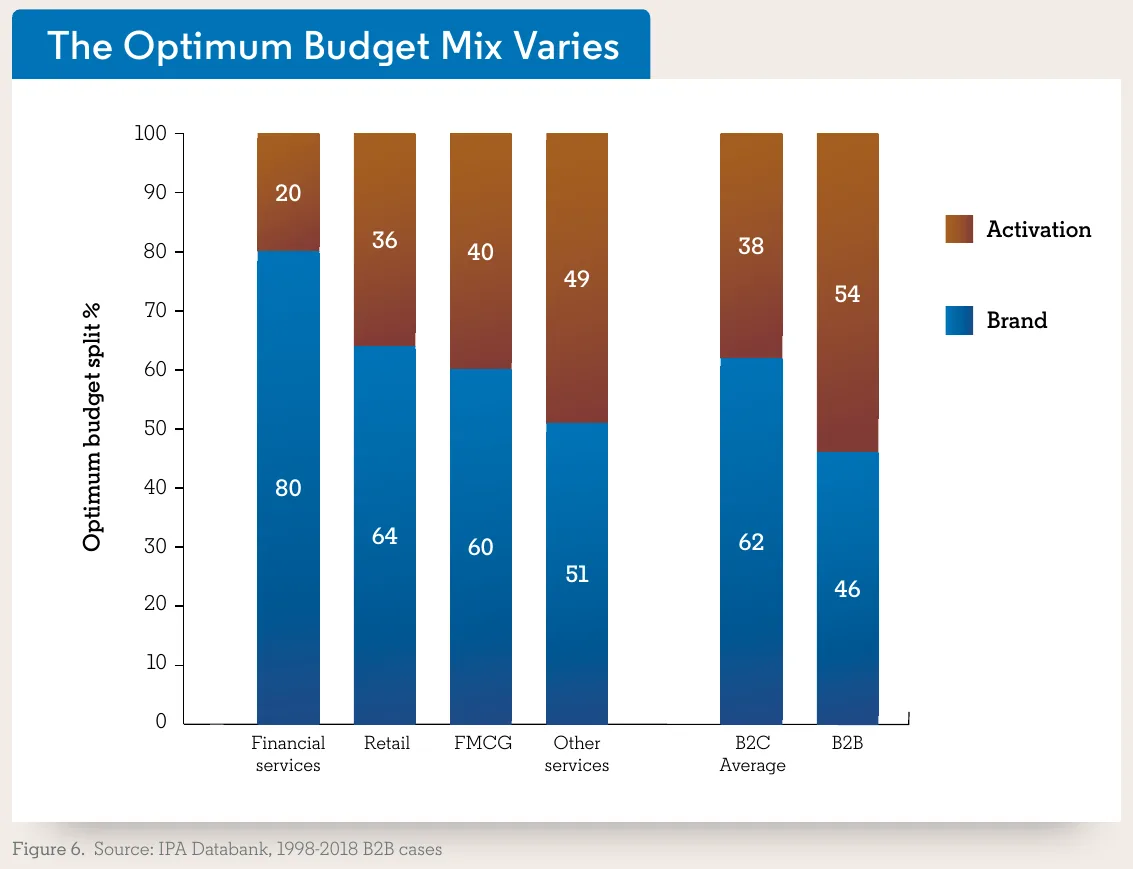
The most quoted ratio is 60% brand and 40% activation, drawn from campaign data in the IPA Databank (the UK’s Institute of Practitioners in Advertising); a later study by Binet and Field, Effectiveness in Context (2018), put it at 62:38 (cited by the IPA in 2023). For B2B, an analysis of the same databank for the LinkedIn B2B Institute found roughly 46:54, and the report warns against applying the figure too precisely because the sample is small (LinkedIn B2B Institute, October 2019). The chart below shows how the optimum varies by category: 80:20 for financial services, 64:36 for retail and 60:40 for FMCG.
I do not apply 60:40 to companies in stages 1 and 2. Brand building needs time and scale, and a new business has neither. I start with about 10% for brand awareness, such as video content, PR and KOLs (key opinion leaders), and raise it step by step in stages 3 and 4.
In The CMO Survey 2026, 66.10% of companies had a larger budget for acquiring customers than for retaining them, and only 17.90% did the opposite. For consumer goods that people buy again and again, I always keep retention (CRM, Zalo, Vietnam’s main messaging app, email and member offers) as a separate budget line so the ad budget does not swallow it.
Within performance, allocate the marketing budget by each channel’s CAC rather than splitting it evenly. If you sell on marketplaces, how to divide money between the two biggest ones is covered in our TikTok Shop vs Shopee comparison, and how Shopee Ads and GMV Max charge you is explained in the guide to retail media in Vietnam. I set aside about 10% of the performance budget for new channels, for example ChatGPT Ads, so that next year I have data to compare.
A 2027 marketing budget sheet: a worked example
Example (hypothetical figures): the herbal shampoo brand above has now reached stage 3, with 2026 revenue of VND 20 billion across its website, Shopee and TikTok Shop. The 2027 target is VND 30 billion. I work through seven steps.
- Separate revenue from existing customers. Based on 2026 repeat purchase rates, existing customers are expected to bring in VND 12 billion in 2027. Revenue needed from new customers: 30 – 12 = VND 18 billion.
- Work out how many new customers you need. The average order is VND 350,000 and a new customer places 1.6 orders on average in their first year (people who arrive late in the year have not had time to buy again), which is VND 560,000 per customer. New customers needed: 18 billion / 560,000 ≈ 32,000.
- Set the CAC ceiling. The margin after cost of goods, marketplace fees and shipping is 45%. Each order earns 350,000 × 45% = VND 157,500. A customer places 2.4 orders in the 12 months from their first order, so 12-month LTV = 157,500 × 2.4 = VND 378,000. CAC ceiling = 378,000 / 3 = VND 126,000.
- Choose a planned CAC. Current CAC is VND 100,000, but the more you spend, the more each additional customer costs. I plan with an average CAC of VND 120,000, still below the ceiling. New customer acquisition budget: 32,000 × 120,000 = VND 3.84 billion.
- Add a retention budget. 4% of revenue from existing customers: 12 billion × 4% = VND 0.48 billion.
- Add brand and testing. Brand building VND 1.2 billion; new channel tests at about 10% of the acquisition budget, rounded to VND 0.38 billion.
- Cross-check. The total is VND 5.9 billion, or 19.7% of target revenue, above the 11.99% reported for B2C product companies in The CMO Survey. But contribution profit before marketing is 30 billion × 45% = VND 13.5 billion; after subtracting 5.9 billion, VND 7.6 billion is left to cover fixed costs and leave a profit. Brand takes 1.2 / 5.9 = 20.3%, right on the stage 3 benchmark.
The VND 3.84 billion acquisition budget is split by each channel’s 2026 CAC: Shopee Ads VND 1.2 billion, TikTok Shop GMV Max VND 1.0 billion, Meta VND 1.0 billion, Google VND 0.44 billion and commission-based KOCs (key opinion consumers) VND 0.2 billion. Channels with a lower advertising cost per new customer get more money; I do not split it evenly to be “fair”.
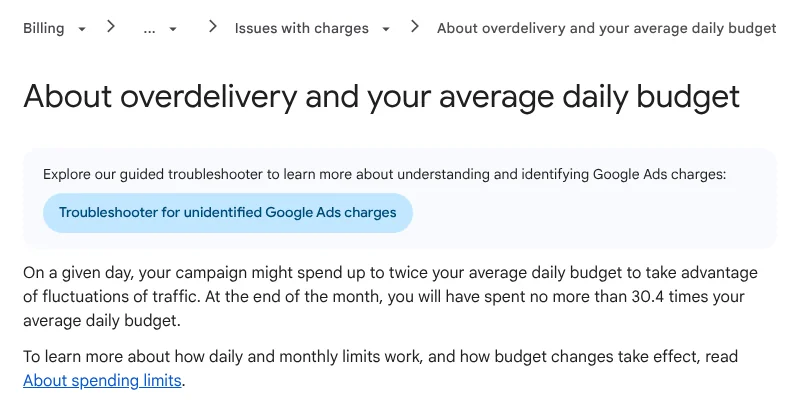
To turn the annual budget into a daily budget in Google Ads: 0.44 billion / 12 ≈ VND 36.7 million a month. Google tells you to divide a monthly budget by 30.4 to get the average daily budget, which comes to about VND 1.2 million a day. On some days a campaign can spend up to twice that amount, but over the month it will not spend more than 30.4 times the daily budget (Google Ads Help, see the image below).
Splitting by quarter: Tet 2027 falls on February 6, so the first quarter is heavy, and the fourth quarter has the 9.9, 10.10, 11.11 and 12.12 sales. My split (hypothetical): Q1 25% (VND 1.48 billion), Q2 18% (VND 1.06 billion), Q3 20% (VND 1.18 billion), Q4 37% (VND 2.18 billion). How to split the budget across the phases of the Tet season is covered in our Tet 2027 marketing plan.
Marketing budget template to copy
Copy this table into Google Sheets or turn it into your own Excel marketing plan template, then add a column for your numbers. It covers the budget part of a one-year marketing plan; messaging and the content calendar are separate work.
| Line | How to calculate |
|---|---|
| 1. Annual revenue target | Enter |
| 2. Revenue from existing customers | Active customers × repeat purchase rate × annual spend |
| 3. Revenue needed from new customers | (1) – (2) |
| 4. First-year revenue per new customer | Average order × orders in the first year |
| 5. New customers needed | (3) / (4) |
| 6. Margin before marketing | 1 – (cost of goods + marketplace fees + shipping) / revenue |
| 7. 12-month LTV in profit | Average order × orders in 12 months × (6) |
| 8. CAC ceiling | (7) / 3 |
| 9. Planned CAC | Current CAC plus the increase from spending more, not above (8) |
| 10. New customer acquisition budget | (5) × (9) |
| 11. Retention budget | (2) × the rate you choose |
| 12. Brand building | Based on the brand share for your stage |
| 13. Testing | (10) × 10% |
| 14. Total marketing budget | (10) + (11) + (12) + (13) |
| 15. Profit check | (1) × (6) – (14), must be greater than fixed costs |
If line 15 is smaller than your fixed costs, go back to line 1: lower the target, raise prices or bring down the planned CAC. That is how you build a marketing budget from the bottom up; survey ratios are only for comparison at the very end.
Before you fill it in, prepare five numbers from 2026: monthly revenue split between new and existing customers, repeat purchase rates by cohort, CAC by channel, gross profit and margin after marketplace fees, and monthly fixed costs. Wherever a number is missing, your marketing cost estimate at that line is a guess. Once you have fixed costs, you can also work out your break-even point for the year.
Mistakes to avoid when setting a marketing budget
- Using a survey average as your budget. Wrong: “Gartner says 7.8%, so we spend 7.8%.” That figure comes from companies in North America, the UK and Europe, not from a business with VND 20 billion in revenue in Vietnam.
- Raising ad spend before product-market fit. Wrong: customers buy once and leave, yet you double the budget to “push sales”. CAC rises, and next month you have to buy customers all over again.
- Leaving no money for testing. Wrong: putting 100% into the channel that works today. When that channel gets more expensive, you have no alternative.
- Locking the budget once for the whole year. Wrong: set it in December and reopen it the following December. I review it every quarter, compare actual CAC and repeat purchase rates with the plan, and move money between lines.
If you want help building a 2027 marketing budget by channel and by quarter for Meta, Google, TikTok and marketplace ads, reach Adtek through our contact page.
References
- The CMO Survey (March 2026). The CMO Survey Topline Report 2026 (fielded January 7 to 29, 2026, US companies).
- The CMO Survey (March 2026). The CMO Survey Firm and Industry Breakout Report 2026.
- Medianews4u (May 2026). CMOs Pour 15% of Budgets Into AI, But Execution Gap Widens: Gartner (figures from the Gartner 2026 CMO Spend Survey, released May 11, 2026; the original page on gartner.com could not be opened, so the figures were checked against this report).
- IPA (September 2023). The next chapter for ‘The Long and The Short of It’.
- LinkedIn B2B Institute (October 2019). The 5 Principles of Growth in B2B Marketing (Les Binet, Peter Field; IPA Databank data, 1998 to 2018).
- Meta Business Help Center. About learning limited (November 2026).
- Google Ads Help. About overdelivery and your average daily budget and Set and change an average daily budget for your campaign (November 2026).
Want to apply this to your business?
Send your question or situation. The Adtek team reads every question and gets back to you.
Prefer to chat? Message us on Zalo Categories
 Recent Posts